Editor’s Note: Matthieu Hyrien is global director of sales and marketing for Geosys, the French satellite imagery startup that was acquired by food and ag company Land O’ Lakes in December 2013.
Hyrien grew up on a farm near Bordeaux, France. After receiving his masters in agronomy, he spent the past 12 years leading Geosys’ efforts in product management, operations, technology, and now sales and marketing.
Taken from a recently released a whitepaper entitled Understanding and Evaluating Satellite Remote Sensing Technology in Agriculture, Hyrien explains four key concepts in remote sensing in agriculture.
Remote sensing technology is playing an increasingly important role in the agriculture sector. From industry consolidation to investment to business agreements, a lot of big dollar decisions are being made. But how well do you truly understand the technology around remote sensing in agriculture?
Here are four key concepts that anyone doing business in the sector should understand. To learn more, you can download our recent whitepaper: Understanding and Evaluating Satellite Remote Sensing Technology in Agriculture.
1. Revolutions and Resolution
Distinguishing between pixel size and other characteristics is important, as they are often forgotten but significant details. When satellite imagery is referred to as “high resolution” it is most likely referring to the spatial resolution – and as a trade-off, the resulting temporal resolution is low.
Currently, no one can offer high spatial and high temporal resolution – so the tradeoff is required. Understanding the effect of the various resolutions helps to evaluate the value of the data based on the needs.
- Pixels: The image is acquired by sampling the light reflected by the surface and recording the measurements in a grid.
- Spatial Resolution: Refers to the smallest object that can be identified on the ground and varies based on the position of the sensors relative to the target. Therefore, pixels within the same satellite image can have different spatial resolutions.
- Temporal Resolution: The amount of time between image acquisitions, or time revisit and the frequency at which data is downloaded to a ground segment.
High spatial, low temporal is best for precision tools that require intrafield analysis. But the type of crop being evaluated effects the value of the spatial resolution. For example, there is little value in ultra-high spatial resolution for large production crops since the equipment used to manage these crops cannot apply treatments at that level of precision. By comparison, an orchard that manages its crop on a plant-by-plant basis will extrapolate more value from the ultra-high spatial resolution data.
Low spatial, high temporal is best for crop monitoring. The more acres and growers an agronomist manages, the more important it becomes to identify which fields need attention quickly. By receiving daily data on a large scale, time management is more efficient and effective.
2. The Spectrum
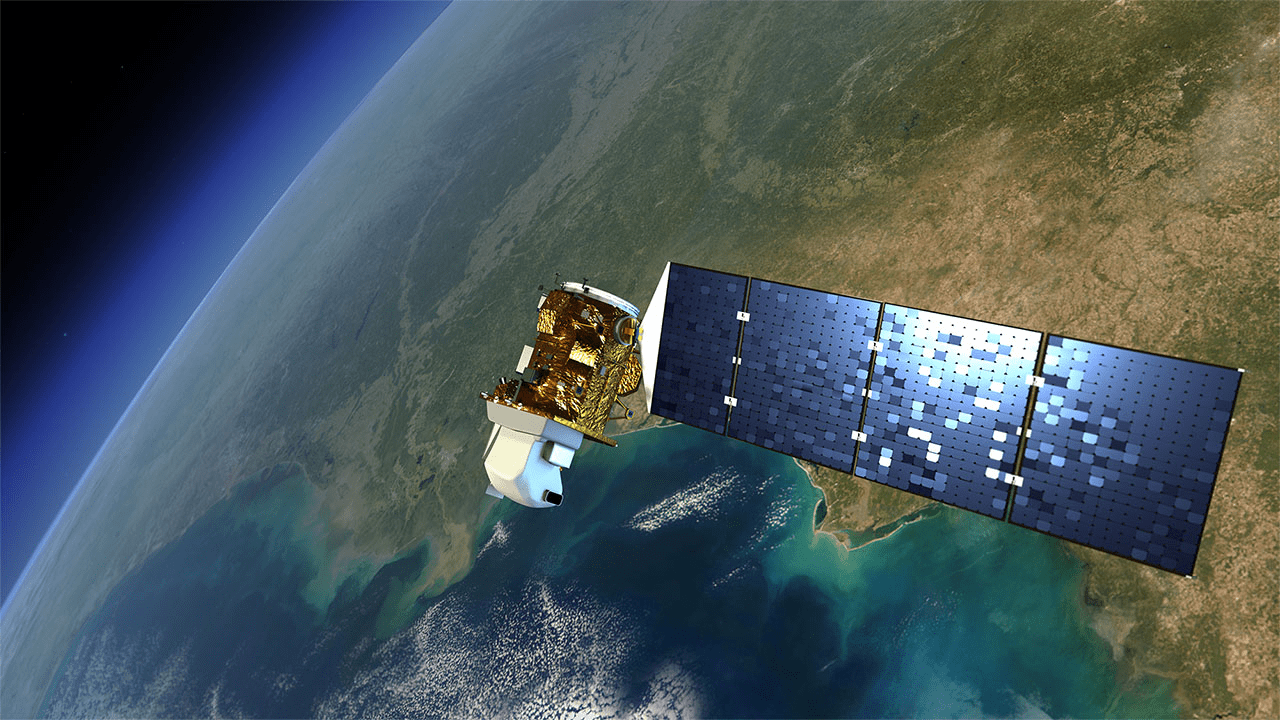
Radiometers on satellites measure wavelengths of electromagnetic radiation being reflected by targets on Earth – known as the spectral response – based on the electromagnetic spectrum. Different objects have different spectral signatures, which provide information on what is being observed.
Because each remote sensing tool (satellite, drone, etc.) has its own spectral band, they do not see the same exact colors for a given surface. This means data being collected from multiple sources cannot be compared to one another without carefully cross-calibrating the data.
3. From Wavelengths to Crop Health
The wavelengths and intensity of the spectral response provide the information needed for vegetation index calculations. Vegetation indices provide an indication of the relative density and health of vegetation for each pixel in a satellite image.
The most common is the Normalized Difference Vegetation Index (NDVI): Sensitive to both biomass and chlorophyll activity, providing a data range from -1 to +1. Since there is more reflected radiation in near-infrared wavelengths than in visible wavelengths, the closer to +1 indicates healthier vegetation. If there is little difference, the vegetation may be stressed or dead – or the data captured is of bare soil.
Ultimately each pixel captured provides a wealth of information that can be used in a variety of calculations to provide multiple data points. The more cloud-free pixels you can capture, the more information you have available and the better the resulting data will be.
4. The Power of Processing
When it comes to agricultural application, satellite imagery is not suitable in its raw form. The information captured from the satellite sensors must be processed before it can be used for analyses such as NDVI. There are several factors that affect imagery captured by a single satellite that must be corrected, including (but not limited to):
- The atmosphere
- Cloud cover
- Shadows due to sun blockage
- Varying spatial resolutions based on the distance from the NADIR
- Varying angles of sunlight based on the curvature of the Earth
- Viewing angle of the sensor
- Topographical distortions
- Environmental effect
Most of these distortions can be removed automatically, given the right algorithms and metadata, but others can be a rather labor intensive process. This is what makes the difference between a pretty, colorful map and actual data that users can capitalize on.
While using remote sensing data doesn’t require an in-depth understanding of how the technology works, having a working knowledge of a few key concepts helps to understand better what is feasible.
Want to write a guest commentary? Email [email protected]
More on remote sensing in agriculture:
4 Things You Should Know about Remote Sensing in Agriculture
February 1, 2017
Matthieu Hyrien
Editor’s Note: Matthieu Hyrien is global director of sales and marketing for Geosys, the French satellite imagery startup that was acquired by food and ag company Land O’ Lakes in December 2013.
Hyrien grew up on a farm near Bordeaux, France. After receiving his masters in agronomy, he spent the past 12 years leading Geosys’ efforts in product management, operations, technology, and now sales and marketing.
Taken from a recently released a whitepaper entitled Understanding and Evaluating Satellite Remote Sensing Technology in Agriculture, Hyrien explains four key concepts in remote sensing in agriculture.
Remote sensing technology is playing an increasingly important role in the agriculture sector. From industry consolidation to investment to business agreements, a lot of big dollar decisions are being made. But how well do you truly understand the technology around remote sensing in agriculture?
Here are four key concepts that anyone doing business in the sector should understand. To learn more, you can download our recent whitepaper: Understanding and Evaluating Satellite Remote Sensing Technology in Agriculture.
1. Revolutions and Resolution
Distinguishing between pixel size and other characteristics is important, as they are often forgotten but significant details. When satellite imagery is referred to as “high resolution” it is most likely referring to the spatial resolution – and as a trade-off, the resulting temporal resolution is low.
Currently, no one can offer high spatial and high temporal resolution – so the tradeoff is required. Understanding the effect of the various resolutions helps to evaluate the value of the data based on the needs.
High spatial, low temporal is best for precision tools that require intrafield analysis. But the type of crop being evaluated effects the value of the spatial resolution. For example, there is little value in ultra-high spatial resolution for large production crops since the equipment used to manage these crops cannot apply treatments at that level of precision. By comparison, an orchard that manages its crop on a plant-by-plant basis will extrapolate more value from the ultra-high spatial resolution data.
Low spatial, high temporal is best for crop monitoring. The more acres and growers an agronomist manages, the more important it becomes to identify which fields need attention quickly. By receiving daily data on a large scale, time management is more efficient and effective.
2. The Spectrum
Radiometers on satellites measure wavelengths of electromagnetic radiation being reflected by targets on Earth – known as the spectral response – based on the electromagnetic spectrum. Different objects have different spectral signatures, which provide information on what is being observed.
Because each remote sensing tool (satellite, drone, etc.) has its own spectral band, they do not see the same exact colors for a given surface. This means data being collected from multiple sources cannot be compared to one another without carefully cross-calibrating the data.
3. From Wavelengths to Crop Health
The wavelengths and intensity of the spectral response provide the information needed for vegetation index calculations. Vegetation indices provide an indication of the relative density and health of vegetation for each pixel in a satellite image.
The most common is the Normalized Difference Vegetation Index (NDVI): Sensitive to both biomass and chlorophyll activity, providing a data range from -1 to +1. Since there is more reflected radiation in near-infrared wavelengths than in visible wavelengths, the closer to +1 indicates healthier vegetation. If there is little difference, the vegetation may be stressed or dead – or the data captured is of bare soil.
Ultimately each pixel captured provides a wealth of information that can be used in a variety of calculations to provide multiple data points. The more cloud-free pixels you can capture, the more information you have available and the better the resulting data will be.
4. The Power of Processing
When it comes to agricultural application, satellite imagery is not suitable in its raw form. The information captured from the satellite sensors must be processed before it can be used for analyses such as NDVI. There are several factors that affect imagery captured by a single satellite that must be corrected, including (but not limited to):
Most of these distortions can be removed automatically, given the right algorithms and metadata, but others can be a rather labor intensive process. This is what makes the difference between a pretty, colorful map and actual data that users can capitalize on.
While using remote sensing data doesn’t require an in-depth understanding of how the technology works, having a working knowledge of a few key concepts helps to understand better what is feasible.
Want to write a guest commentary? Email [email protected]
More on remote sensing in agriculture:
Join the Newsletter
Get the latest news & research from AFN and AgFunder in your inbox.
Related Stories
Investment in agriculture gene editing grew 206% YoY in H1 2024, hinting at sector recovery and new momentum
AI could be ‘the next thing’ to move agronomic recommendations forward, says ag retailer survey
Guest article: AI can transform precision agriculture, but what are the legal risks?
Ray of hope for farmers using DJI ag spray drones following release of Senate version of defense spending bill
Get the latest news and research from AFN & AgFunder in your inbox.
Follow us:
Sponsored Content
Sponsored
Restoring the soil quickly is key to capturing returns in regenerative agriculture
Editor's Pick
Methane-busting feed supplements are beginning to scale. But who will foot the bill, and what will drive widespread adoption?
Frankly Speaking
Meati Foods CEO on ‘flawless retail execution,’ setting ‘goals grounded in reality’ and sweating manufacturing assets
Data Snapshot
From novelty to necessity? The evolution of insect farming
Investor Insight
FMC Ventures’ Mark Brooks on the next 10 years in agtech investment: ‘One of the risks is that we repeat the same mistakes’
Meet the Founder
From driverless cars to precision ag with eFeed cofounder Kumar Ranjan: ‘I’m kind of an accidental entrepreneur’
Research & Data
Investment in agriculture gene editing grew 206% YoY in H1 2024, hinting at sector recovery and new momentum