Corporates missing sustainability targets is an old problem, but there’s a new urgency surrounding it in light of accelerating climate change and agrifood’s responsibility for one third of global emissions. While consumers, investors and governments are demanding more traceability and sustainability in the food supply chain, companies themselves still puzzle over how to even measure their socio-environmental impact.
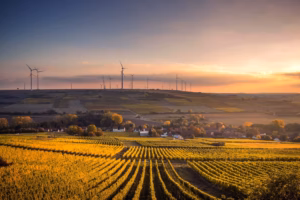
When it comes to land-intensive industries, the urgency is even greater. Forest, land and agricultural sectors account for roughly one quarter of global emissions; they also hold immense potential when it comes to removing and storing carbon.
One barrier to companies taking meaningful actions, says sustainability intelligence platform HowGood, is a lack of available methods and standards.
As HowGood’s chief innovation officer Ethan Solovievtold told AgFunderNews last year, “the tedious task of sorting through individual studies and research impedes making informed, sustainable changes.”
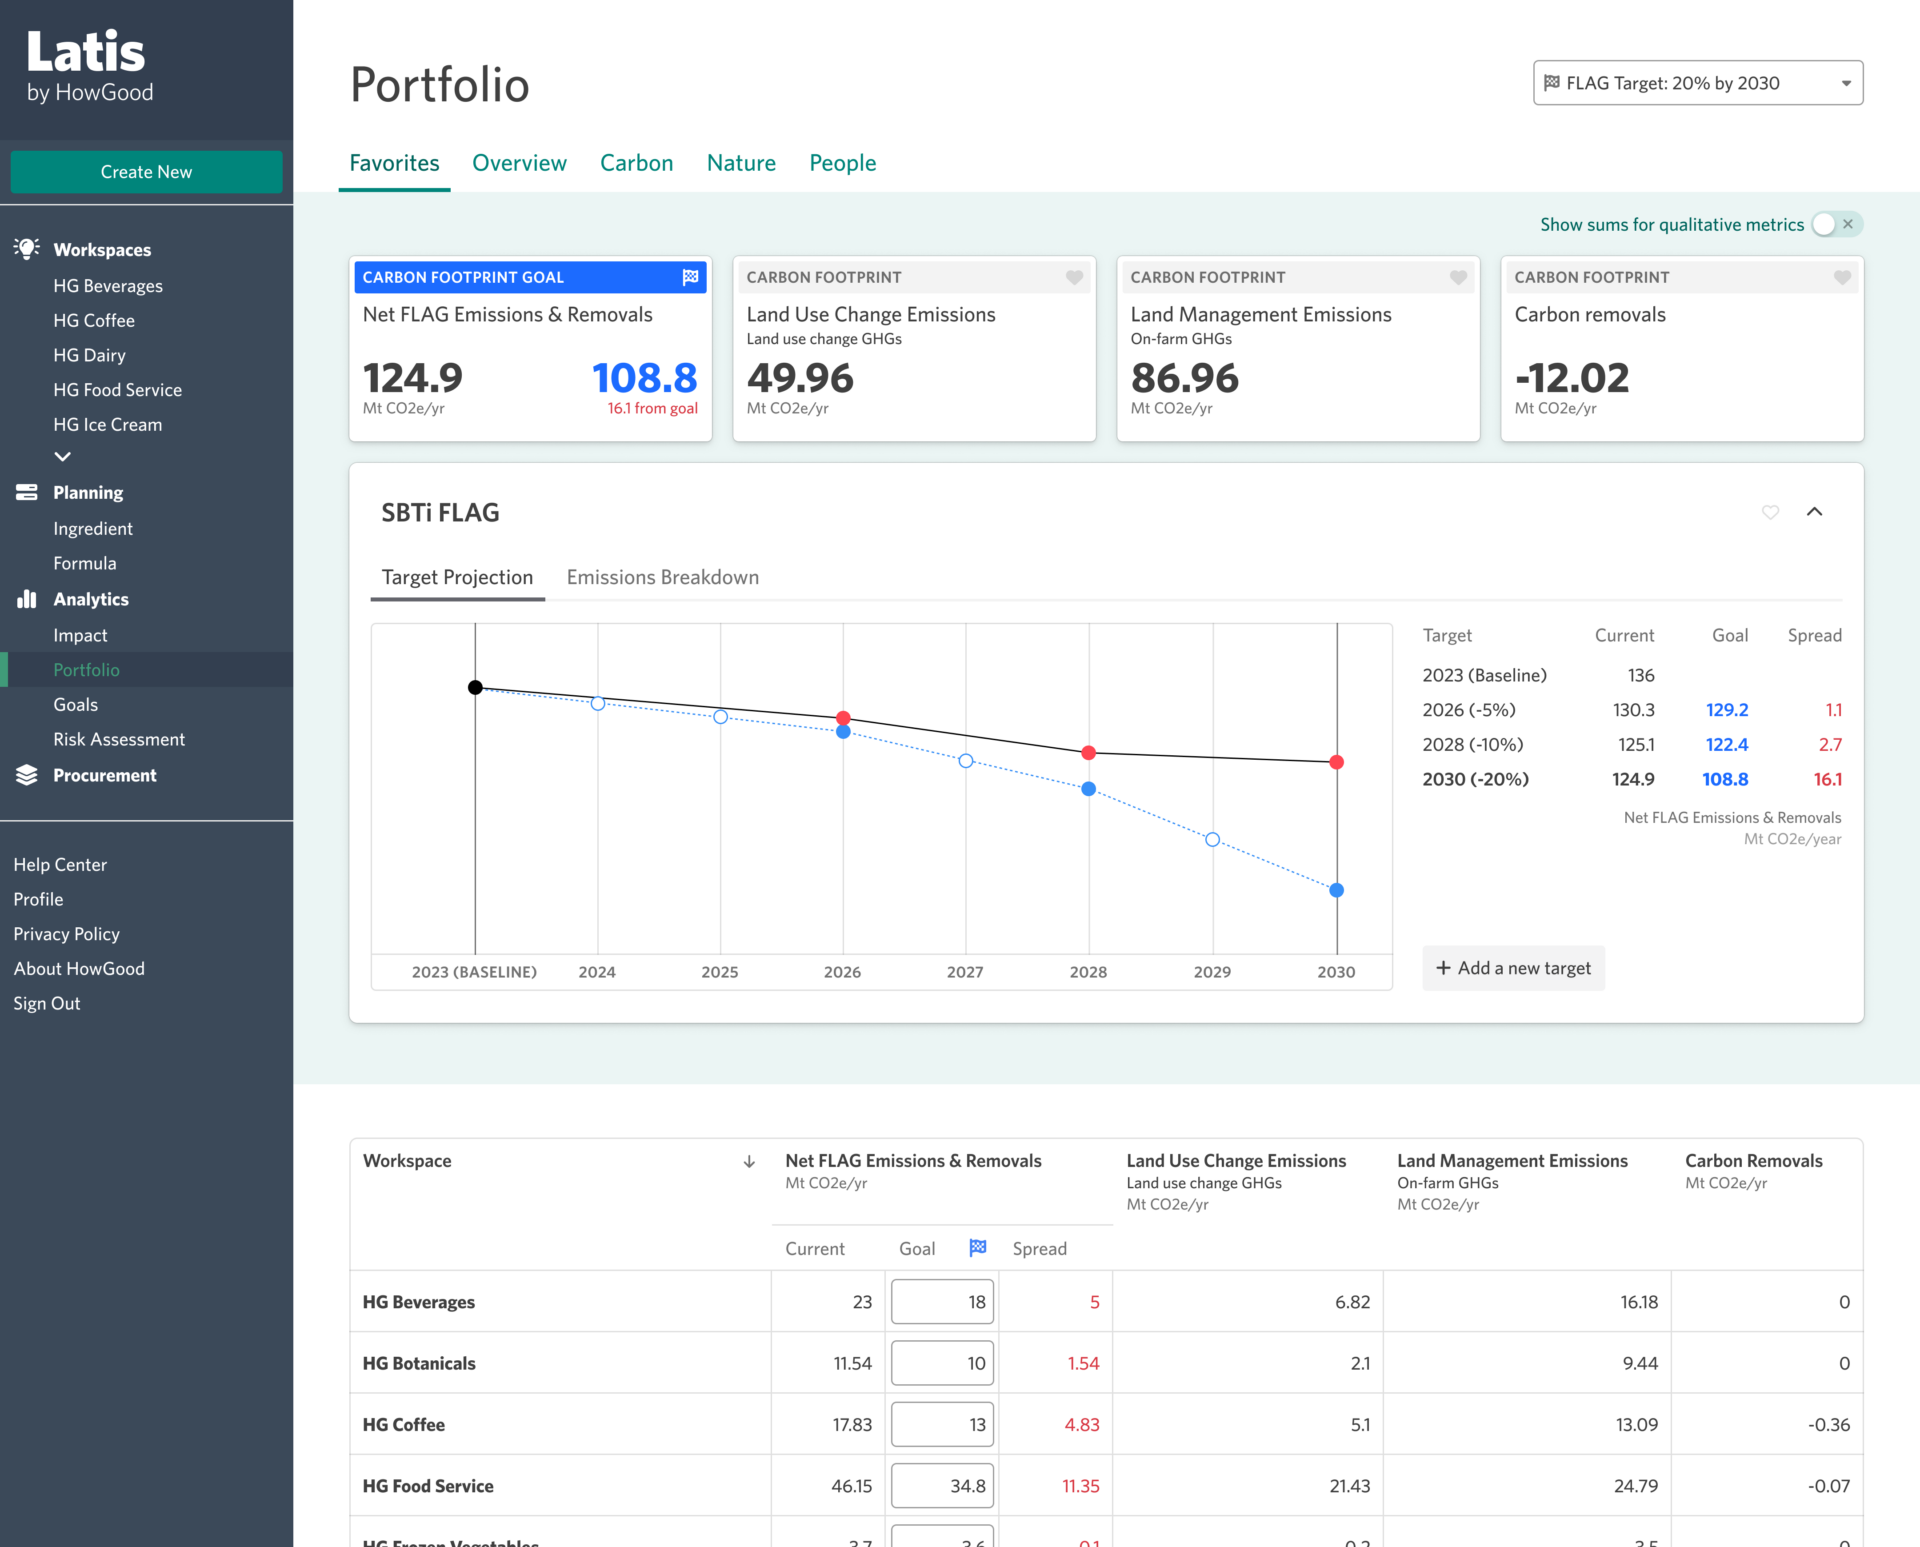
HowGood recently released a tool that addresses the problem. Its FLAG emissions dashboard, available within the company’s SaaS platform Latis, aims to help food and beverage companies establish accurate emissions baselines and outline strategies for improving sustainability practices.
The product comes ahead of updates to the FLAG (Forest, Land, and Agriculture) guidelines established by the Science Based Targets initiative (SBTi), which works with companies to set emissions reduction goals. The guidance is meant to offer companies a “science-based understanding” of how quickly they need to cut land-related emissions to stay in line with the Paris Agreement goal of limiting global warming to 1.5°C above pre-industrial levels.
Tracking land use with ‘very granular data’
“One of the biggest benefits to our tool is that we have very granular data,” Lizz Aspley, lead data scientist at HowGood, tells AgFunderNews.
HowGood’s Latis tool uses more than 600 sources of data to provide companies with intelligence on over 33,000 ingredients. Fairtrade America, the European Commission, the USDA National Agricultural Statistics Service, and Biodiversity International are some examples of the organization’s data partners.
This lets food companies calculate their socio-environmental impact and also tweak their products to be more in line with sustainability goals around emissions, water usage, labor risk and other factors.
The new FLAG database adds land use to the mix.
“Looking at your FLAG permissions within our tool, you have a very easy way of seeing [FLAG emissions], even across a very large portfolio,” explains Aspley, who leads the work on the tool. “We break it out between land management and land use change. But then our tool also allows you to reformulate products and see how it would impact those emissions as well.”
How it works
“Customers can use the FLAG data base to baseline their emissions as they relate to forest land and agriculture,” says Aspley. “But then they can also use the tool after they’ve set targets with SBTi to put those those goals within Latis and work towards their actual reduction targets.”
Say a food company has 50 different products they produce for the same CPG. The company can upload the formulations of these 50 products into HowGood’s Latis tool.
Analyzing how much of each ingredient goes into that final product, HowGood’s system then assesses its environmental and social impact against the following metrics: greenhouse gas emissions; processing (e.g., energy used to make the product); blue water usage; biodiversity impact; soil health; land use; animal welfare; and labor risk.
For each metric, products get a score of 1–10, with 10 being the highest, or “regenerative.” Those individual metric scores are then consolidated into one overall impact score out of 100.
Once all formulations are in, companies can see a baseline that can be put into the SBTi FLAG tool, which will provide a reduction target.
Latis, meanwhile, can tell a company how wide the gap is between that target and where a company is currently. For example, it will tell a company what its most carbon-intensive ingredients are and help the user model alternative formulations and sourcing scenarios.
“We really drill into the details and give a very granular breakdown,” says Aspley. “Not all crackers are going to look at the same,” she adds, by way of example.
From measuring to reducing
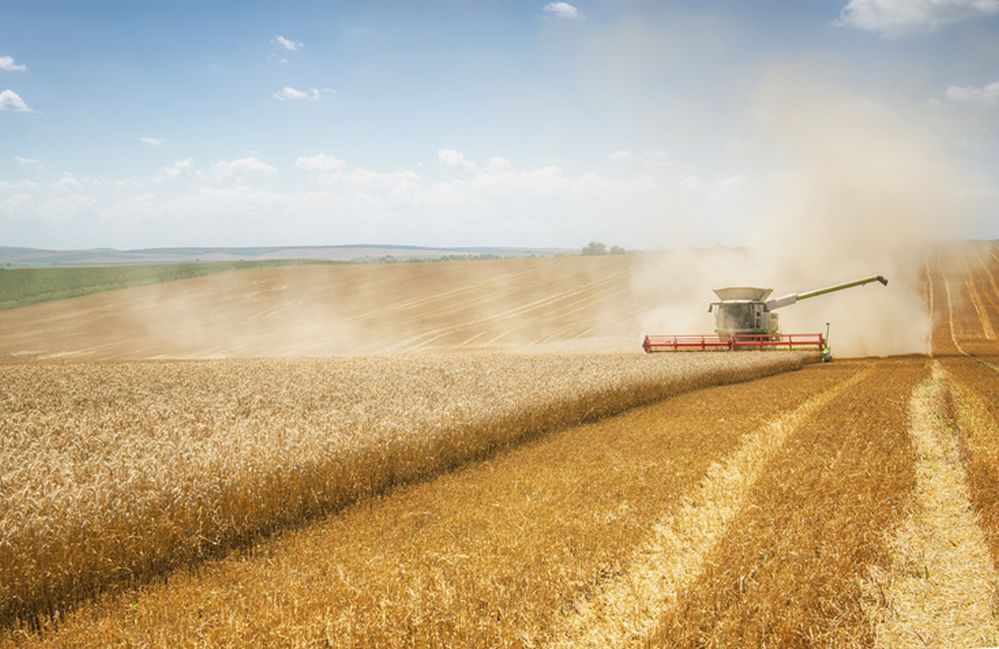
Corporate sustainability targets rarely account for land-based emissions, which include things like deforestation for land use and methane and fertilizer emissions, among other areas. For some, those emissions — which usually fall under Scope 3 — are as high as 80% of a company’s overall emissions.
“I think [the FLAG database] is going to be really key, especially as customers move past baselining and get into their specific suppliers,” says Aspley.
“The land sector harnesses the most efficient and effective nature-based solutions for removing and storing carbon. Reducing deforestation is one of the most critical climate change mitigation activities that we as the food industry have,” says Soloviev, “We are inspired by what FLAG offers to more accurately measure greenhouse gas emissions in line with scientific standards, and excited for what Latis can do to bring an action- oriented tool to those working hard to not only measure, but reduce land-sector emissions.”