Editor’s Note: Emily Negrin is director of global communications & marketing for Geosys, the satellite imagery analytics business. For Earth Day, we asked her to provide an overview of how climate change has impacted agriculture industries all over the world using data from the company’s 2019 Climate & Crop Report. Once owned by Land O’ Lakes, Geosys was acquired by UrtheCast in 2018.
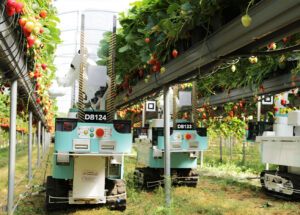
Geosys has been monitoring crops across the globe using industry-leading geoanalytics from satellite and weather data for more than 30 years. Through the unbiased lens of data analytics, our team evaluates the impact of weather on crop production in key growing regions. As weather is an ongoing reflection of local changes in climate we experience, it allows us over time to evaluate impacts of climate change as we compare resulting crop production trends. The need for more resilient and sustainable agricultural practices is undeniable. Through enhanced crop monitoring, we can support better in-season management decisions that mitigate risk in order to meet the demands of a growing population.
How Climate Change Impacted Weather in 2019
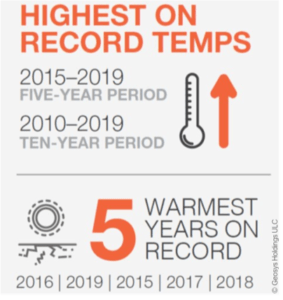
Since the 1980s, each decade has been warmer than the previous one as the average global temperature has risen by approximately 1.1°C since the pre-industrial era. While 2016 remains the warmest year – due to the warming impact of a very strong El Niño event in addition to the climate change trend – 2019 was the second warmest year on record.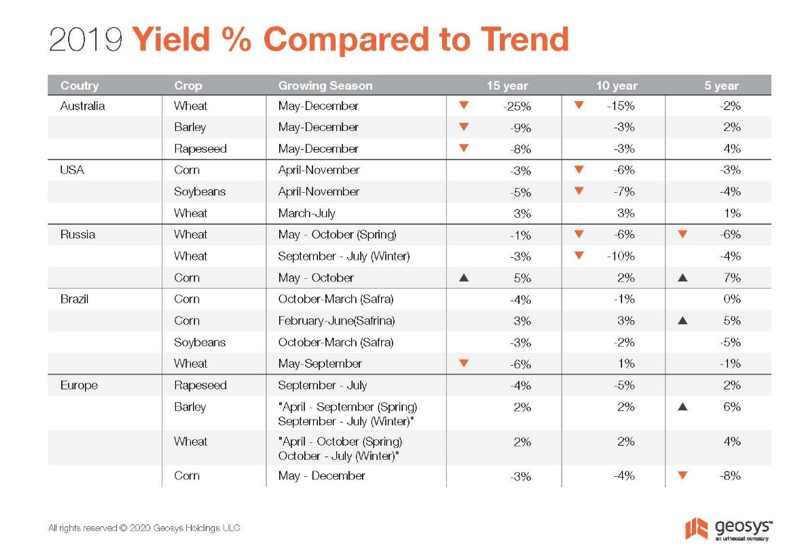
This is a trend that we have seen continue into 2020 as the first quarter of the year has been warmer than average. And unfortunately, it’s a trend we expect will continue due to record levels of heat-trapping greenhouse gases in the atmosphere. According to the World Meteorological Organization (WMO) Secretary-General, “On the current path of carbon dioxide emissions, we are heading towards a temperature increase of 3 to 5 °C by the end of century.”
On a day-to-day basis, the impacts of climate change play out through extreme and “abnormal” weather. Heatwaves and floods that used to be a once-in-a-century occurrence are becoming more regular while tropical cyclones are more powerful and precipitation patterns are more erratic. All these climate change impacts increase weather vulnerability – posing an even greater threat to crop yields.
Impacts on Yield: Heat, Floods, Droughts & Fires
 Looking to the past provides a way to analyze the impacts with 20/20 hindsight. The following charts provide an overview of yield performance for key growing regions compared to the 5-, 10- and 15-year trend averages in some of the most impacted regions. These are areas in which climate change created some of the most extreme weather. While we can see how advancements in various forms of technology have helped decrease the impact in some areas, weather trends are still of great concern as these extreme events become more frequent and damaging. We cannot predict with certainty what the current or future years will bring, so accurately monitoring conditions in real-time is crucial for the industry in order measure risks and adapt courses of action.
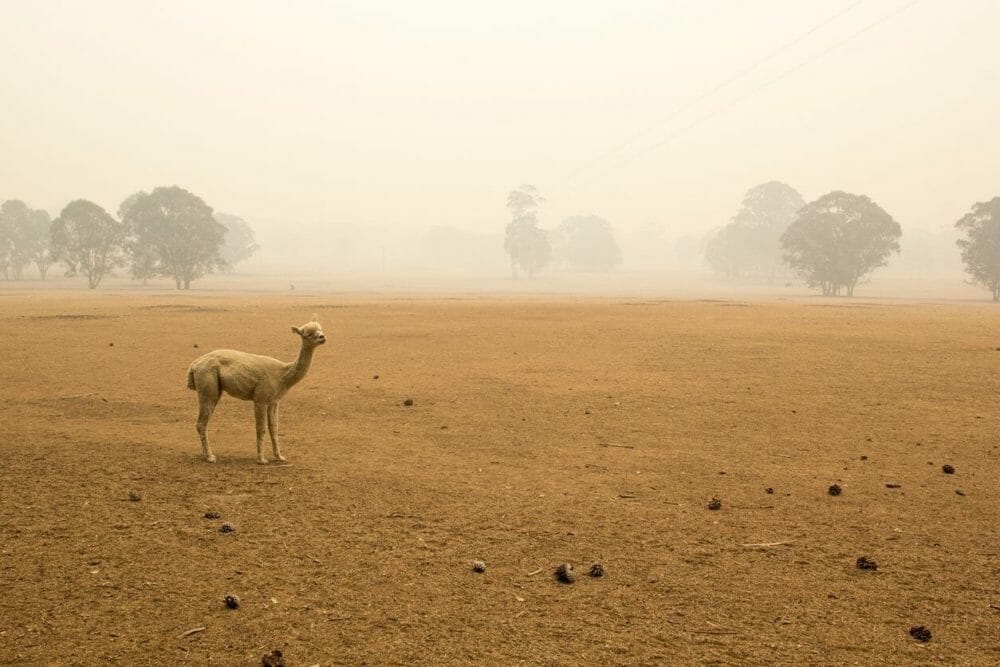
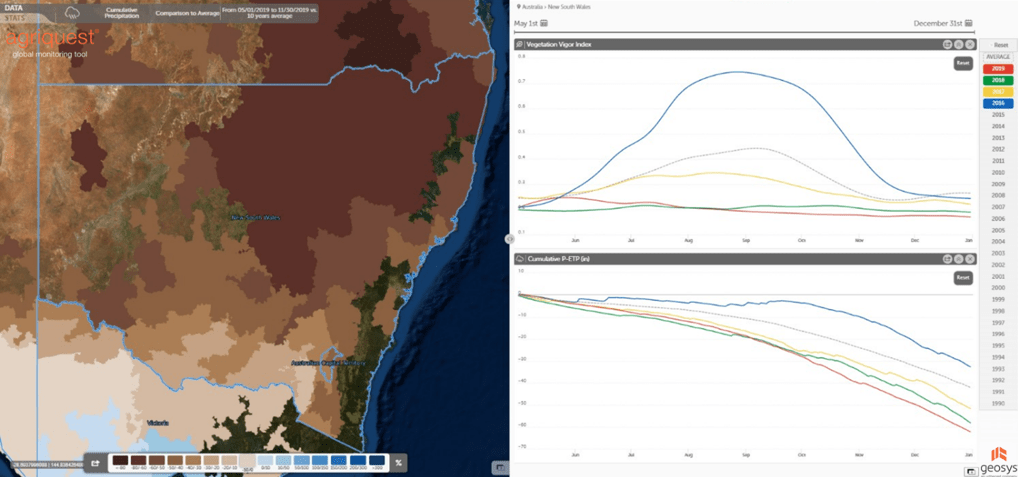
Australia experienced its driest stretch in 120 years from September to December of 2019. The bushfires that raged on into 2020 started earlier than usual and became one of the most significant events in terms of spatial area burned. December 18, 2019 marked the hottest national average temperature on record at 41.9°C. Dryness across the whole country accelerated crop losses and resulted in cutting cereals for hay as animal feed. Wheat suffered the greatest negative impact while barley and rapeseed managed to avoid similar losses. The 2019 season ended below the yield trend average for all three crops.
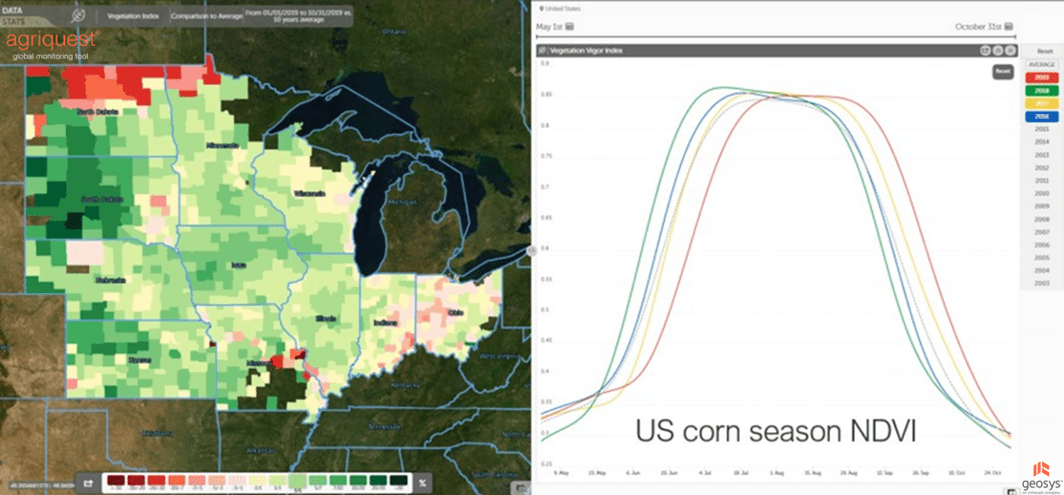
In the United States, 2019 started with an exceptionally wet period from January to May – marking the wettest period on record in the contiguous U.S. since 1895. This led to multiple significant and damaging floods across part of the Plains, Midwest and Mississippi River Valley. The season began under historically wet conditions, causing planting delays that were evident in the NDVI. While the second half of the season saw improved performance resulting in better-than-expected production, the season ended with harvest delays due to wet conditions across the Dakotas and Minnesota. With the early arrival of snow and freezing temperatures, 5% of U.S. corn production will remain in the field until this spring.
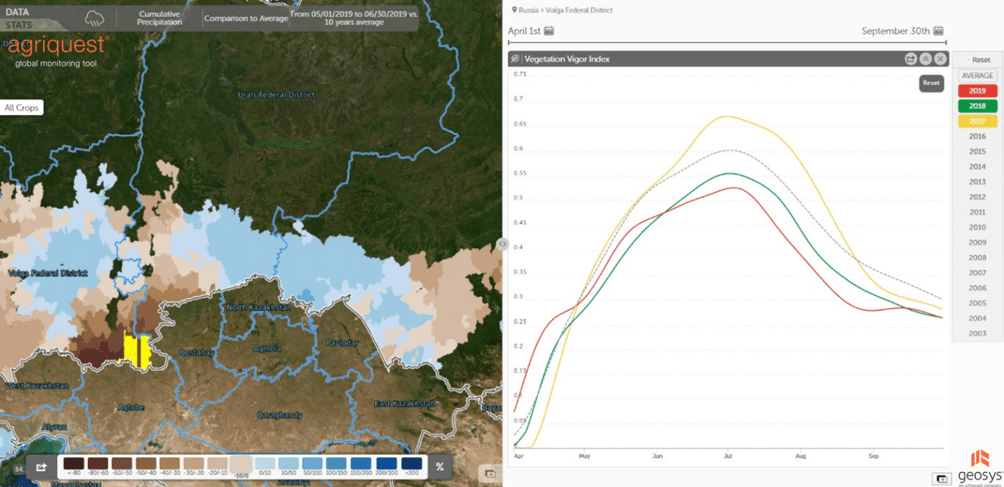
Russia started with good weather, however dry and hot spells from May onward lowered yield potential for winter and spring wheat. While the Volga region was disrupted with heavy rains, the east faced drought conditions. A cool trend at the end of the summer did limit the impact of the drought on corn, resulting in record levels for the season.
For Brazil, the 2019 season was characterized by hot and dry growing conditions for Safra (first crop) and improved conditions for Safrinha (second crop). The case of Brazilian wheat is a perfect illustration of the risk to arable crops from climatic hazards. Wheat is grown mainly in the states of Paraná and Rio Grande do Sul where a long dry period began in early June and continued through the end of the wheat season. Cumulative rainfall in Paraná was 80% below normal and cold episodes during heading reduced grain fertility. At this development stage, temperatures below 4°C are detrimental to the plants. This threshold was breached several times which negatively impacted yield at 6% below trend line average.
Europe experienced above-normal precipitation totals recorded in multiple regions, so flooding became substantial during the fall. The most significant event in Italy occurred in mid-November because of several low-pressure systems that originated in the western Mediterranean. In Southern France, two notable “Mediterranean episodes”, a phenomenon that brings intense storm systems mostly during the autumn months, occurred November 22-23 and December 1-2, leading to significant floods. This was a sharp contract to the dry conditions experienced July through September. Specifically, France had a total of 34 consecutive days (August 19–September 21) without rain, its second-longest dry spell on record. However, the drought situation was milder than it was in 2018, due to increased precipitation at the end of year.
For more insights on the impacts of Climate Change on global crops, view the complete 2019 Climate & Crop Report which contains more details on the weather events and insights on 10 major cropping regions.