
Editor’s Note: Barclay Rogers is chief executive of Good Earth Irrigation, a data analytics startup focused on identifying sustainable irrigation opportunities. On a quest to understand the forces at play in the agricultural economy, and to assess the role that agtech could play in this economy, Rogers has written a two-part in-depth analysis for AgFunderNews. He may be reached at
[email protected] or via LinkedIn.
Making Agtech Matter in Today’s Agricultural Economy
Agriculture technology (agtech), as it’s known today, burst onto the scene with the blockbuster sale of Climate Corporation to Monsanto in 2013, and has been gaining in prominence ever since.[1] AgFunder, the online investment platform for the sector, reports that funding jumped from $2.06 billion in 2014 to $4.6 billion in 2015.[2]
The timing has not been not ideal, however, as the explosion in agtech innovation and investment has coincided with a collapse in the broader farming economy. Net farm income peaked in 2013 and has fallen precipitously since then.[3] Purdue University reported that American corn farmers made on average $254 per acre in 2013, and predicts that they are likely to lose $34 per acre this year.[4]
The situation today begs several questions: How will the burgeoning agtech sector fare in a contracting agricultural industry? Will agtech companies fall flat as farmers retrench in tight economic times? Or will they soar as farmers embrace new technologies to improve their bottom line? Will some of them succeed while others fail, and if so, can we predict who is likely to win and why?
Agtech Taxonomy

Before exploring the potential fate of agtech, it’s important to break the agtech companies into different groups. While no taxonomy is perfect, the following categories and subcategories of agtech companies provide a useful guide:
- Farm-Level Analytics
- Aerial and Satellite Imagery
- Farm-Level Profit Optimization
- Field-Level Production Optimization
- Sensing
- Genetics and Biochemistry
- Improved Seeds
- New Crops
- Pesticides, Herbicides, and Synthetics
- Food, Synthetic Food, and Food Processing
- Farm to Consumer
- Food Delivery
- New Crops and Synthetic Food
- Food Safety and Processing
‘Genetics and Biochemistry,’ as well as the ‘Food,’ ‘Synthetic Food,’ and ‘Food Processing’ categories are, to a certain degree, removed from the agricultural market, and face fundamentally different risk profiles — such as food consumption patterns and regulatory approvals. As a result, this article focuses exclusively on ‘Farm-Level Analytics,’ including ‘Aerial and Satellite Imagery,’ ‘Farm-Level Profit Optimization,’ ‘Field-Level Production Optimization,’ and ‘Sensing,’ with particular emphasis on applications to corn production as it is the largest single crop grown in the United States.[5]
Farm-Level Economics Are Challenging
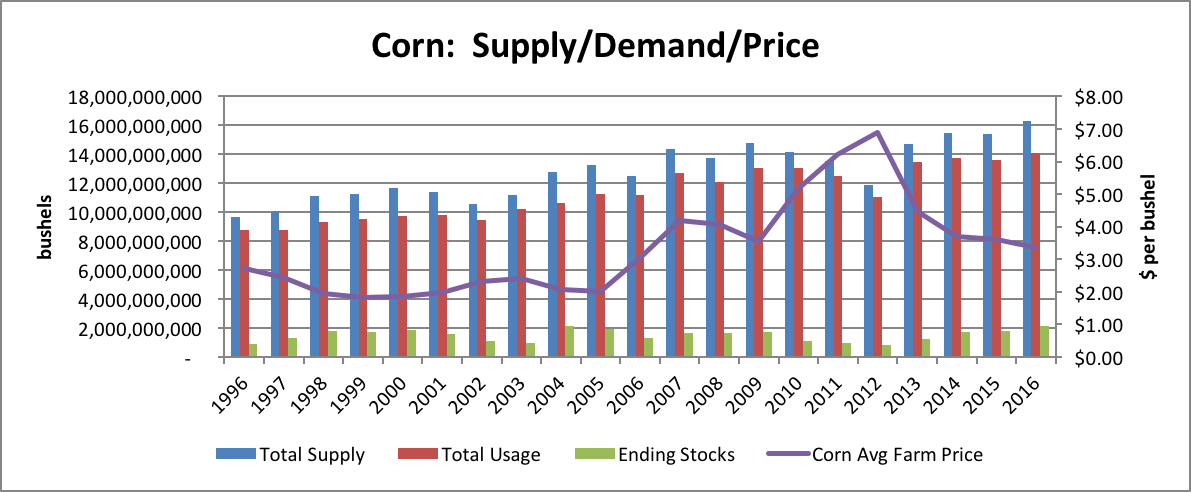
As explored in the first part of this series, the agricultural economy is in a malaise. Supply is overwhelming demand and thus driving down commodity prices. Commodity prices look unlikely to recover in the short-term as farmers continue to push production to record highs, and demand appears unlikely to catch up any time soon.
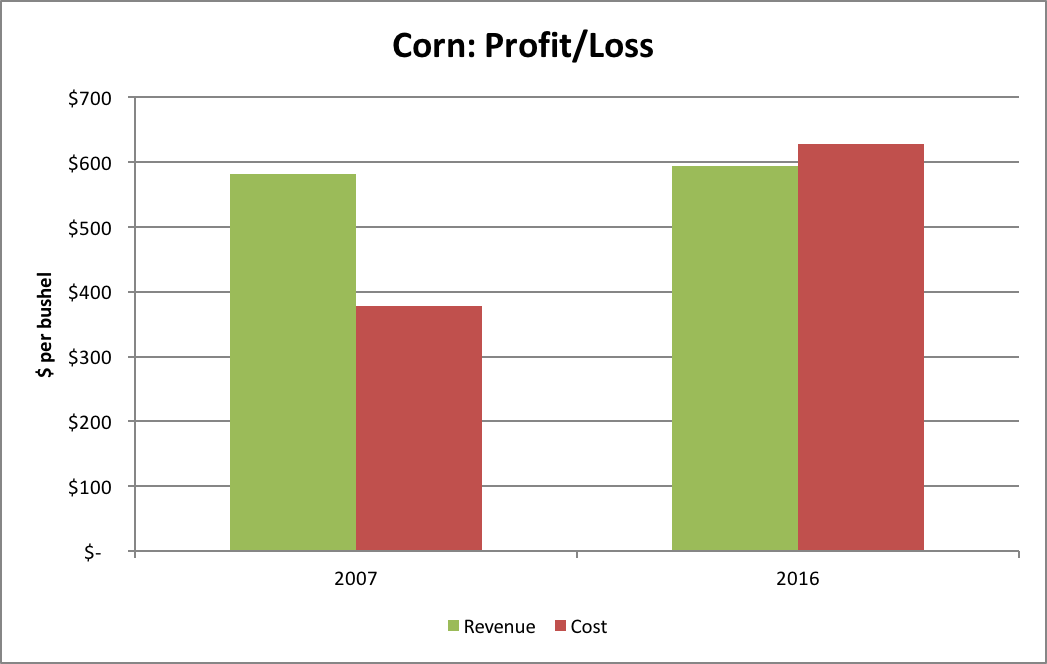
Farmers appear poised to pursue increased efficiencies and lower costs as a way to restore profitability. Purdue University has published crop budgets that estimate yields, prices, and costs for the past 14 years. Since 2007, corn production costs have increased from $378 per acre to $678 per acre. At the same time, corn yields have gone from 147 bushels per acre to 165 bushels per acre. Correspondingly, the unit cost to produce corn has grown from $2.42 per bushel in 2007 to $3.81 per bushel in 2016 (i.e. a 58% rise). Unfortunately, the price for a bushel of corn has fallen from $3.71 per bushel in 2007 to $3.60 per bushel in 2016. It goes without saying that an industry is in trouble if it costs more to produce something than the price at which one can sell it.[6]
Focus on the Things That Matter
Revenues and costs are the two sides of the profit coin. But it’s worth a closer look to understand the potential effects on the bottom line. Yields and prices affect top-line revenue, and increases in either are sure fire ways to boost profitability. For example, a 6% increase in either yield or price would be sufficient to move from an operating loss to break even under the Purdue corn budget assumptions for 2016.[7]
A number of agtech companies are focused on boosting yields, and these companies should fare well if the yield benefits substantially exceed their costs of implementation. A corn farmer obviously will not pay $5 per acre for a new yield-boosting technology unless he is convinced that it will reliably increase yields by more than 2 bushels per acre (i.e. $5/acre < 2 bu/acre x $3.60/bu). That said, yields exhibit significant variability from year to year and from field to field, so agtech companies may struggle to convince farmers that yield increases are attributable to any particular technology.
Agtech companies should similarly focus on helping farmers secure the best price for their crops. Commodity prices swing throughout the year based upon a host of factors, and agtech companies that can help farmers secure the best prices and hedge their downside risks are adding real value. It’s worth noting that a 1% yield increase or a 1% price increase have the exact same effect on revenue (a 1% increase), but it may be much easier for technology companies to assist farmers in obtaining better prices in sometimes opaque markets than it is to boost on-farm yields.
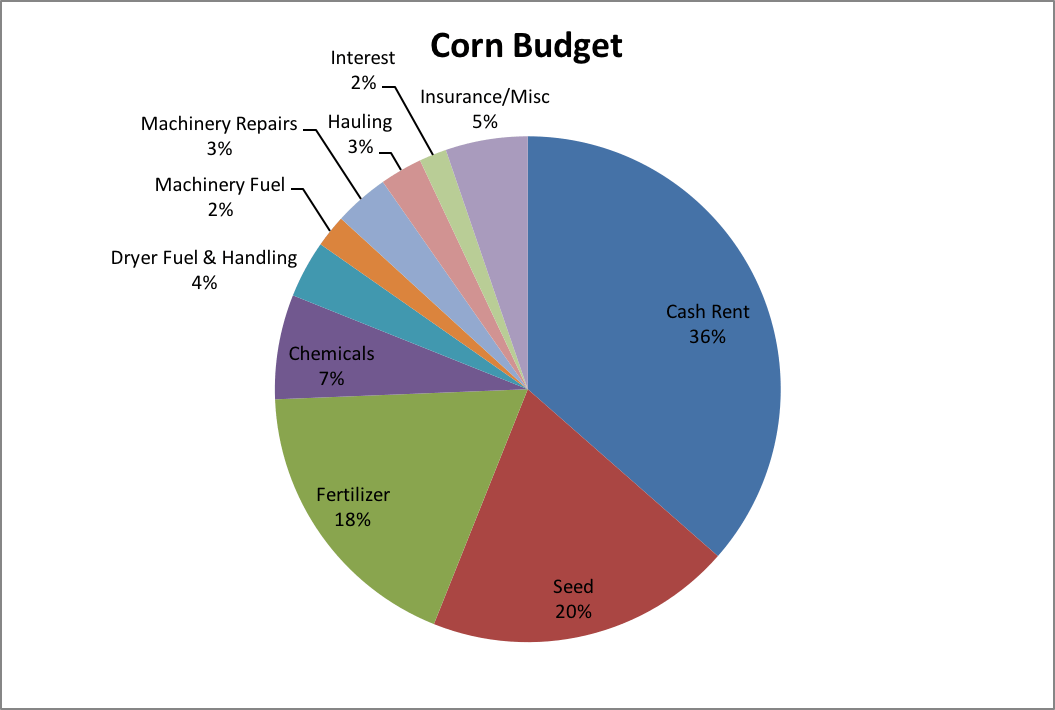
Similarly, agtech companies can aid farmers by helping them reduce variable input costs. For example, using the Purdue budget numbers, a 28% decrease in seed costs would be sufficient to reach break-even holding all other things constant. Of course, precision farming rarely targets a single input, and instead tends to focus on optimizing production across multiple variables. A 12% combined reduction in seed, fertilizer, and chemicals would be sufficient to break even under the Purdue budget without any increase in yield or price. Agtech companies that help farmers to optimize their inputs costs without compromising yields are likely to be some of the biggest winners in the agtech market.
Cost controls are likewise very valuable. For example, holding all other things constant, a 15% decrease in cash rents would be sufficient to reach break even under the Purdue corn budget assumptions for 2016.[8] Using the Purdue numbers, a farmer is projected to incur a cost of $399 per acre to grow corn, excluding cash rent. That farmer is projected to produce 165 bushels per acre and to be able to sell those bushels for $3.60 each, resulting in projected revenue of $594 per acre. Consequently, the farmer should be able to insist that he pay no more than $195 per acre in rent for average farmland, assuming he doesn’t own it, as any greater rent would mean that he would incur a loss. However, according to Purdue, average farmland rents for $229 per acre, thus forcing the farmer to incur an operating loss.
Farmland cash rents are often rather “blocky” (e.g. cash rents may vary based upon regions or general characterizations such as high, average, and low-quality farmland), and wide variation can exist in rents when viewed on a productive capacity (e.g. $/bu) basis for the particular fields in question. Agtech companies can assist farmers by helping them to understand where they are overpaying in rent relative to the productive capacity of the land.
Required Single Input Reduction To Achieve Break Even
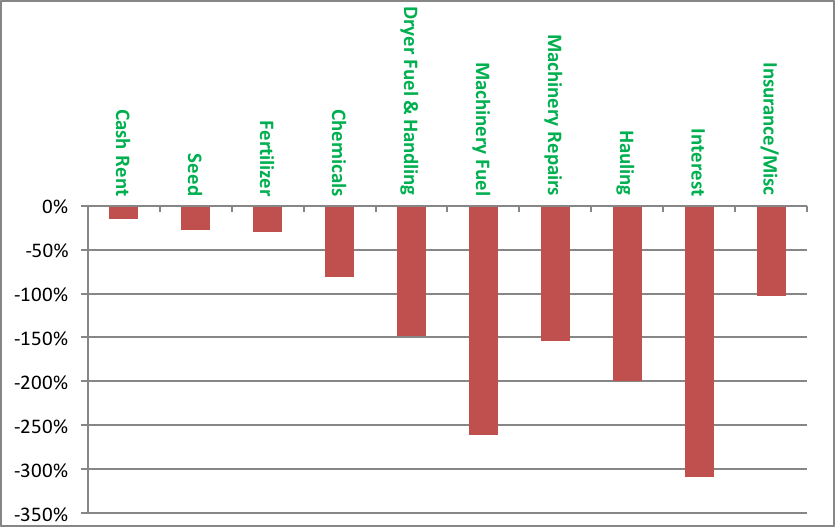
Interestingly, a number of agtech companies are focused on optimizing irrigation water usage. While hugely important from an environmental perspective, the marginal cost of water use is relatively small compared to other agricultural inputs — at least with respect to corn production in the Midwest. Demonstration projects in Nebraska have shown water savings of approximately 1.5 to 2.0 acre-inches of water per year — corresponding to a 15% to 20% water use reduction — can be achieved through soil moisture monitoring and water use estimating techniques.[9] Cost savings associated with such water use efficiencies are realized through pumping cost savings as most agricultural groundwater users are not required to pay usage fees. Pumping costs are a function of the volume of water pumped, depth to water, discharge pressure requirements, and pump efficiency. For instance, a 100% efficient pump powered by a diesel generator that is required to lift water 150 feet and discharge it at 60psi would consume approximately 2.63 gallons of diesel per acre-inch of water pumped.[10]
Consequently, a farmer adopting such water-saving techniques can save approximately 3.95 to 5.26 gallons of diesel per acre per year, corresponding to $7.50 to $10.50 per acre per year. [11] While certainly laudable from an environmental perspective, such water use efficiencies have much less effect on a farmer’s bottom line relative to savings on other inputs. For example, $10 per acre savings correspond to a 4% reduction in seed, fertilizer, and chemicals collectively compared to a 20% reduction in water use. In other words, it’s much easier to save money by targeting multiple inputs as opposed to singling out a particular one.
Interesting Opportunities Above the Ground
Aerial imagery companies are interesting entrants onto the agtech scene. These companies range from satellite companies focused on acquiring frequent, high-resolution imagery, to companies looking to process those images for particular applications. Some of these companies use satellites; others use airplanes, and others use drones.[12] Regardless of their imagery acquisition mode, these companies believe that interesting applications for frequent, multi-spectrum imagery exist in agriculture.
The primary question, of course, is what value is created through aerial imagery? Farmers have long sought to evaluate fields and diagnose problems by visual observation, and frequent aerial imagery should make this process simpler and more complete. Some farmers and their advisors will be interested in acquiring aerial imagery to assist in diagnostics, but it’s doubtful that they will abandon their other inspection practices, such as walking the fields and driving the perimeters, as such techniques permit closer inspection.
The farm and field level analytic companies are likely best positioned to utilize aerial imagery by coupling imagery with input decisions (e.g. seeding rates relative to plant stands) and output results (planting dates relative to crop canopies) to generate important insights. To be of greatest effect on the farm, these imagery services will need to be incorporated into other analytic platforms as opposed to offered as stand-alone services, and will likely be adopted slowly as farmers and their advisors gradually incorporate them into their existing production optimization strategies.
The bigger market for aerial imagery may lie beyond the farm. According to a report that analyzed global commodity market data in 2010, options and futures trading for corn and soybeans exceeded $650 billion per month, while actual sales of corn and soy were $224 billion for the year.[13] In other words, trading in corn and soybean financial derivatives exceeded the value of the underlying crops by roughly 35 times. Major participants in these markets strive to profit from information. For example, former Cargill CEO Greg Page told the Wall Street Journal that “hen we do a good job of assimilating all those seemingly unrelated facts, it provides us an opportunity to make money…without necessarily having to make directional trades, i.e., outguess the weather, outguess individual governments.”[14] Aerial imagery could provide extremely valuable information to these large and sophisticated markets.
Another interesting application of aerial imagery may be in crop insurance. More than 280 million acres of farmland were insured under federal crop insurance programs in 2012, corresponding to $117 billion in potential liabilities.[15] Crop insurance programs have been gaining in prominence and, following the Agricultural Act of 2014, now constitute the primary form of commodity support in the US.
Federal Crop Insurance[16]
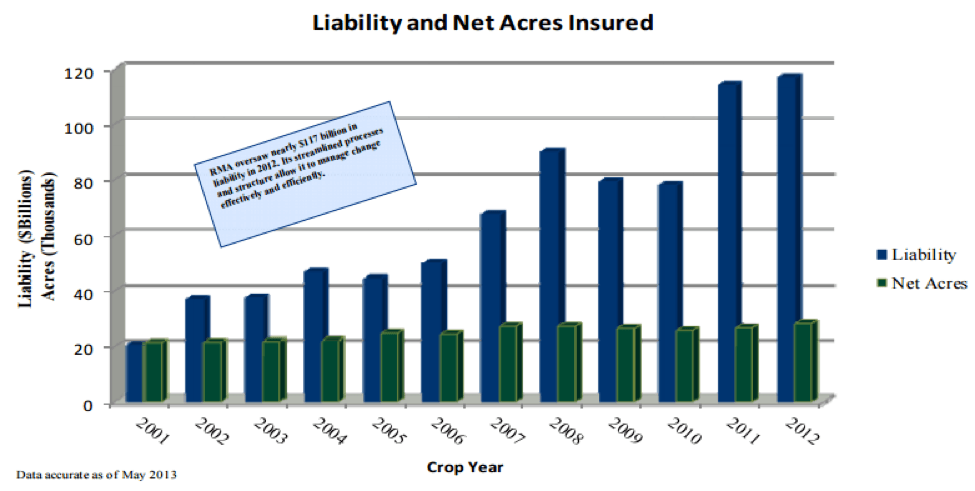
Aerial imagery may prove to a very useful tool in underwriting and assessing crop insurance claims. Crop insurance applications of aerial imagery may prove to be much easier, and potentially of more value, compared to field-level analytics to optimize crop production.
Conclusion
Agtech is here to stay. But given the contraction in agricultural markets, agtech companies will need to be laser-focused on value creation. While much of the emphasis to date has been on field level optimization, applications that help maximize profitability, or that address broader agricultural markets, may prove to be of most value.
Footnotes
[1] Precision farming and other forms of agricultural technology existed long before 2013, but the Climate Corp sale triggered serious interest in the area. See http://news.monsanto.com/press-release/corporate/monsanto-acquire-climate-corporation-combination-provide-farmers-broad-suite.
[2] See AgFunder, 2015 Investing Report, https://agfunder.com/research/agtech-investing-report-2015.
[3] Choices, an on-line publication of the Agricultural and Applied Economics Association, recently issued a series of articles on farm finance. See http://www.choicesmagazine.org/choices-magazine/theme-articles/farm-fiance-theme-are-the-good-times-really-over/theme-overview-are-the-good-times-really-over.
[4] Purdue Crop Budgets and Purdue Cash Rent Surveys. Average productivity soil, rotating corn using revised budgets (where available) were used to estimate revenues and variable production costs. Average quality land was used for cash rent estimates. See https://ag.purdue.edu/commercialag/Pages/Resources/Management-Strategy/Crop-Economics/Crop-Budget-Archive.aspx; https://ag.purdue.edu/agecon/Pages/Purdue-Agricultural-Economics-Report-Archive.aspx.
[5] Corn grown for grain accounted for 87.4 million acres out of a total of 242.1 million acres of U.S. row crop production in 2012. Soybeans, which are often grown interchangeably with corn and frequently exhibit similar economics, accounted for an additional 76.1 million acres; consequently, the combined corn and soybean market comprises roughly 67% of all U.S. row crop production. One may, therefore, derive a pretty clear view of the U.S. farm-level economics by evaluating U.S. corn supply and demand dynamics. See https://www.agcensus.usda.gov/Publications/2012/Online_Resources/Highlights/Farms_and_Farmland/Highlights_Farms_and_Farmland.pdf
[6] The figures in this paragraph come from the Purdue Crop Budgets and Purdue Cash Rent Surveys. Average productivity soil, rotating corn using revised budgets (where available) were used to estimate revenues and variable production costs. The average quality land was used for cash rent estimates. See https://ag.purdue.edu/commercialag/Pages/Resources/Management-Strategy/Crop-Economics/Crop-Budget-Archive.aspx; https://ag.purdue.edu/agecon/Pages/Purdue-Agricultural-Economics-Report-Archive.aspx.
[7] Yield improvements can be illusory as they ultimately drive down prices assuming demand remains flat, but they can nevertheless improve the economics for early adopters.
[8] Yield improvements can be illusory as they ultimately drive down prices assuming demand remains flat, but they can nevertheless improve the economics for early adopters.
[9] Irrigation applications for corn production in Nebraska average 10 acre-inches per year; consequently, a reduction of 1.5 to 2.0 acre-inches of water would correspond to 15% to 20% water savings. See http://agecon.unl.edu/a9fcd902-4da9-4c3f-9e04-c8b56a9b22c7.pdf; https://www.ksre.k-state.edu/irrigate/oow/p11/Kranz11a.pdf.
[10] Irrigation pumping efficiencies are discussed in Evaluating Energy Use for Pumping Irrigation Water. See https://www.ksre.k-state.edu/irrigate/oow/p11/Kranz11a.pdf.
[11] At a cost of $1.90 per gallon for off-road diesel. See www.scgemn.com/Current-Refined-Fuel-Prices.
[12] It’s not clear which mode of imagery acquisition (e.g., drone, plane, or satellite) will emerge as dominant, but the metrics dictating success will likely be frequency, resolution, and cost of the images.
[13] For a discussion on the size of agricultural commodity markets, see https://www.ici.org/pdf/per18-03.pdf.
[14] Davis, Cargill’s Inside View Helps It Buck Downturn, Wall Street Journal (Jan. 14, 2009), http://www.wsj.com/articles/SB123189501407679581.
[15] For information on federal crop insurance, see http://www.rma.usda.gov/pubs/rme/aboutrma.pdf.
[16] This figure appears in a fact sheet about the USDA Risk Management Agency, see http://www.rma.usda.gov/pubs/rme/aboutrma.pdf.